
In today’s digital landscape, having a website is just the beginning; it’s what you do with it that realy counts. Whether you’re running a small blog, an e-commerce store, or a corporate site, understanding how your website is performing is crucial to its success. This is where Key Performance Indicators, or KPIs, come into play. But what exactly is a website KPI, and why should you care? Imagine trying to navigate a ship without a compass – that’s what managing your online presence feels like without tracking the right KPIs. in this article, we’ll dive into the world of website KPIs, demystifying what they are and highlighting which ones you should be keeping an eye on. By the end, you’ll have a clearer picture of how to steer your website toward success and achieve your goals with confidence. Let’s get started!
Understanding Website KPIs and Their Importance
When it comes to managing a website,understanding Key Performance Indicators (KPIs) is crucial for measuring effectiveness and driving growth. kpis provide insights into how well your website is performing against its goals. These metrics help identify areas that need improvement and can guide your strategies for optimization.
Some of the most meaningful KPIs to track include:
- Traffic Sources: Knowing where your visitors are coming from (organic search, paid ads, social media, etc.) can help you allocate resources effectively.
- Bounce Rate: A high bounce rate may indicate that your content isn’t meeting visitor expectations or that your site isn’t engaging enough.
- Conversion Rate: This metric reflects the percentage of visitors who complete a desired action,such as signing up for a newsletter or making a purchase.
- Average Session Duration: A longer session duration typically indicates that visitors are finding your content valuable and engaging.
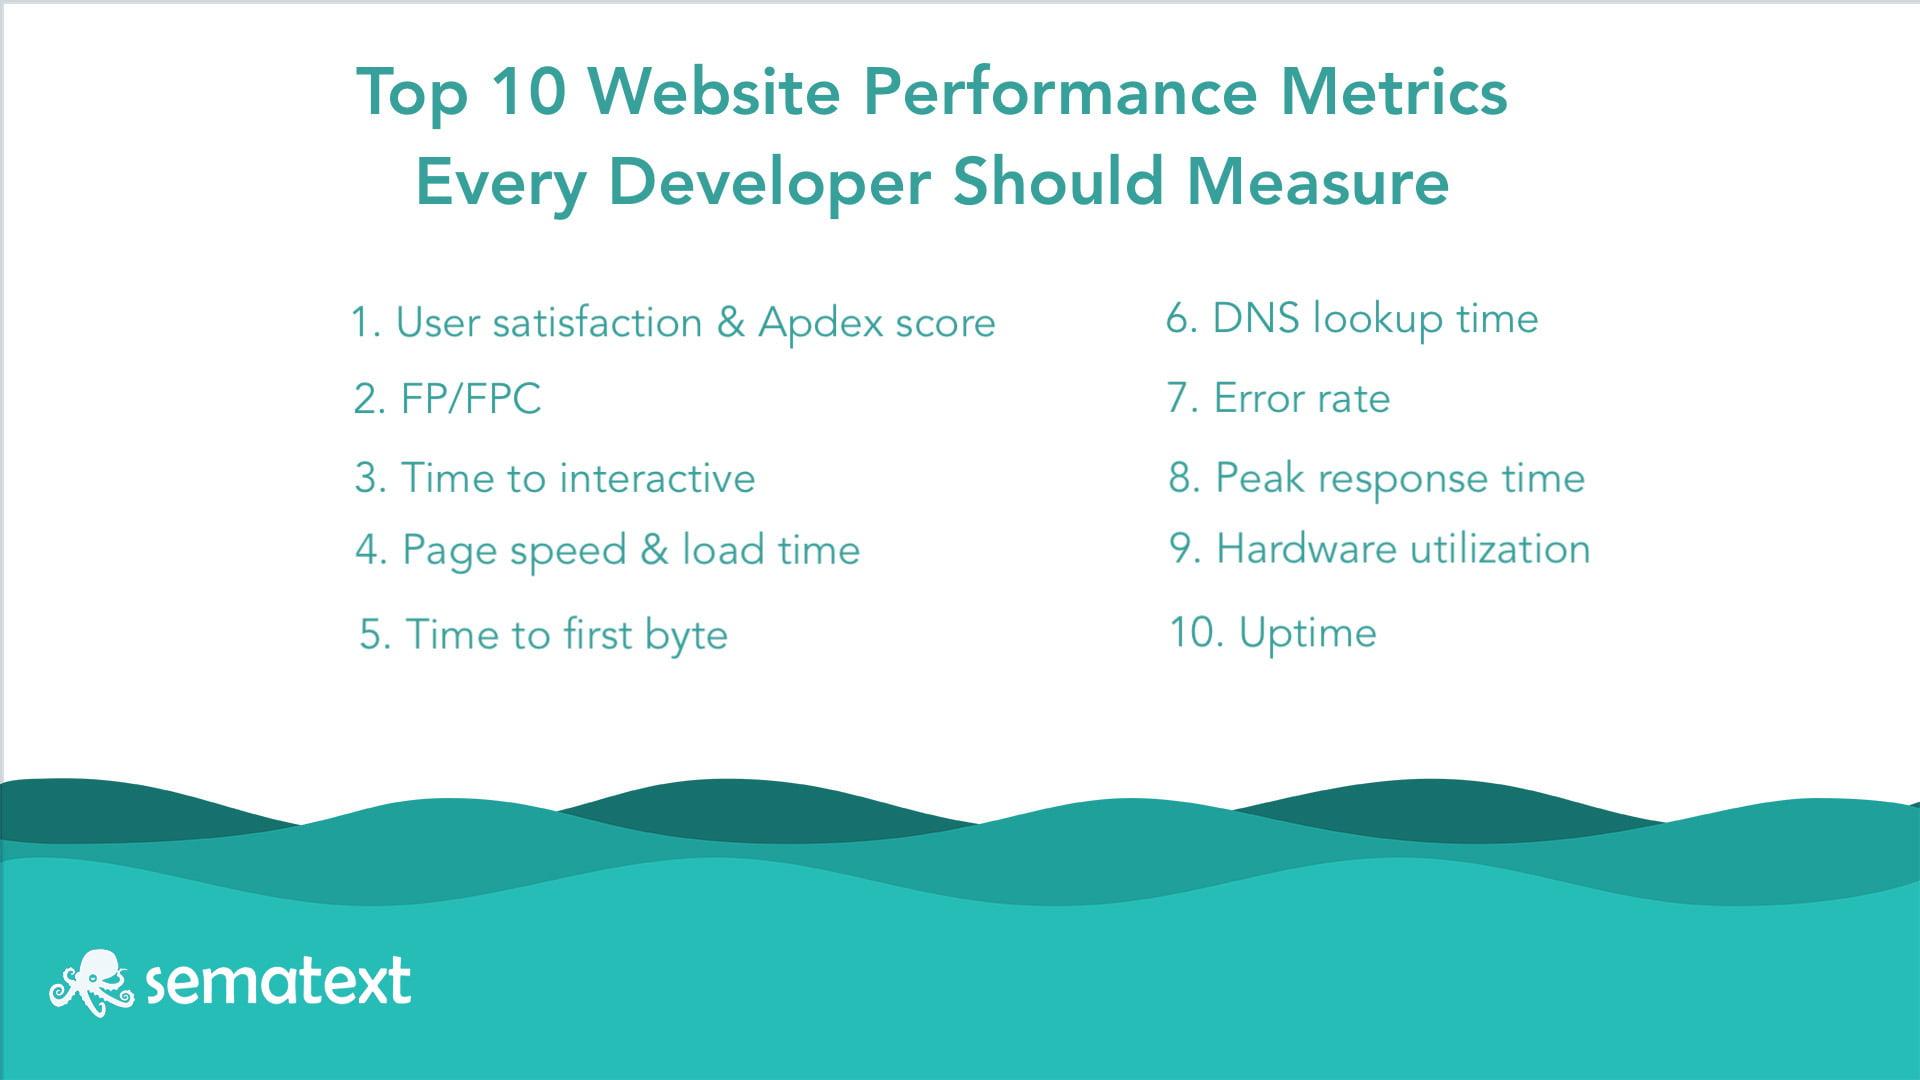
- Page Load Time: Faster load times improve user experience and can positively affect your search engine rankings.
Understanding these metrics is essential, but it’s equally significant to set benchmarks and goals for each KPI. this way, you can measure progress over time. such as, if your current conversion rate is 2%, you might set a goal to increase it to 3% within the next quarter. Regularly reviewing these metrics not onyl helps in tracking progress but also in making informed decisions about your marketing strategies.
Additionally, visualizing this data can significantly enhance your understanding of trends and patterns.Consider using tables or charts to display your KPIs clearly. For instance:
| Metric | Current Value | Goal |
|---|---|---|
| Traffic sources | 70% Organic | 75% Organic |
| Bounce Rate | 60% | 50% |
| Conversion rate | 2% | 3% |
KPIs are not just numbers; they tell a story about your website’s performance and user engagement.By monitoring these key metrics diligently,you not only highlight the strengths of your website but also pinpoint weaknesses that require attention.This proactive approach can help you stay ahead in the competitive online landscape.
The essential Metrics That Define Success
When it comes to measuring the performance of your website, understanding key performance indicators (KPIs) is crucial. These metrics shed light on how well your site is achieving its goals and help you identify areas for improvement. Here are some essential metrics that can define your success:
- Traffic Sources: Knowing where your visitors come from is vital. break it down into categories like organic search, paid ads, social media, and referrals. This helps you allocate resources effectively.
- Conversion rate: this metric shows the percentage of visitors who take a desired action, such as signing up for a newsletter or making a purchase. A higher conversion rate usually indicates that your website is effectively guiding users toward those actions.
- Bounce Rate: The bounce rate indicates the percentage of visitors who leave your site after viewing just one page. A high bounce rate might suggest that your content isn’t engaging enough or that your site’s design is off-putting.
- Average Session Duration: This metric tells you how long users stay on your site. If visitors are spending more time browsing your content, it’s a sign that your site is engaging and relevant to their interests.
To visualize these metrics effectively, consider using a table to summarize performance data over time. This can help you spot trends and make informed decisions. Here’s an example:
| Month | traffic Sources | Conversion Rate | Bounce Rate | Avg. Session Duration |
|---|---|---|---|---|
| January | Organic: 60%,Paid: 25%,Social: 10%,Referral: 5% | 3.5% | 45% | 3:30 |
| February | Organic: 65%, Paid: 20%, Social: 8%, Referral: 7% | 4.0% | 42% | 4:00 |
In addition to these metrics, tracking customer satisfaction through surveys or feedback forms can provide insights into user experience. Engaging with visitors to understand their needs can enhance loyalty and improve conversion rates.
Don’t forget about the importance of search engine rankings.Keeping an eye on your keyword performance helps you understand how well your content is optimized for finding. It’s not just about traffic; it’s about the right kind of traffic that converts.

How to Choose the Right KPIs for Your Business Goals
Choosing the right key performance indicators (KPIs) for your business goals is essential to ensure you’re measuring success effectively. Start by aligning your KPIs with your overarching objectives. Ask yourself what you want to achieve in the short and long term. Are you aiming for increased traffic, higher conversion rates, or improved customer satisfaction? Each goal will require a different set of KPIs to track.
Next, make sure your KPIs are specific, measurable, achievable, relevant, and time-bound (SMART). This framework can help you clearly define what success looks like for your website. As a notable example, if your goal is to increase website traffic, a KPI such as “monthly unique visitors” would be both measurable and specific.
It’s also vital to consider the source of your data. Different tools can provide various insights,but it’s crucial to choose ones that will give you accurate and actionable data. Google Analytics is a powerful tool for tracking a range of website KPIs,such as page views,bounce rate,and session duration.Make sure you’re familiar with how to navigate these tools to pull the most relevant data for your needs.
Another critically important aspect is the frequency of measurement. Some KPIs may need to be reviewed daily, while others might be more suitable for weekly or monthly analysis. For example,tracking the number of clicks on a call-to-action button can be monitored daily,but assessing your overall conversion rate may be more effective on a monthly basis.
Here are some commonly tracked website KPIs you might consider:
- Traffic Sources: Understand where your visitors are coming from (organic search, paid ads, social media, etc.).
- Bounce Rate: Determine the percentage of visitors who leave after viewing only one page.
- Conversion Rate: Measure the percentage of visitors who complete a desired action like signing up or making a purchase.
- Average Session Duration: Evaluate how long users are engaging with your content.
don’t forget to regularly review and adjust your KPIs. As your business evolves,so will your goals and the metrics that matter most. Setting a routine to assess the effectiveness of your chosen KPIs will help ensure you stay aligned with your objectives and can pivot as necessary.
| Goal | Recommended KPIs |
|---|---|
| Increase Traffic | Monthly Unique Visitors, Traffic Sources |
| Improve Engagement | Bounce Rate, Average Session Duration |
| Boost Conversions | Conversion Rate, click-Through Rate |
Traffic Metrics: What You Need to Know
Understanding traffic metrics is crucial for any website owner or digital marketer aiming to gauge the performance and effectiveness of their online presence.These metrics provide insights into how users are interacting with your site,allowing you to make informed decisions that can enhance user experience and boost conversions.
here are some key traffic metrics you should focus on:
- Visitor Count: This is the total number of individuals visiting your site over a specific period. Tracking visitor count helps you assess the overall reach of your website.
- Page Views: This indicates how many times pages on your website have been viewed. It’s a great way to gauge the interest in your content.
- Bounce Rate: A high bounce rate suggests that visitors are leaving your site quickly, frequently enough indicating that the content isn’t engaging or relevant.
- average Session Duration: This metric reveals how long users spend on your site. Longer sessions typically indicate that visitors find your content interesting.
- Traffic Sources: Understanding where your visitors come from—whether through search engines, social media, or direct visits—can inform your marketing strategy.
To effectively monitor these metrics, it’s essential to utilize tools like google Analytics, which can provide detailed reports and dashboards. Implementing these insights will allow you to refine your content and marketing strategies, ultimately leading to better engagement and higher conversion rates.
| Traffic Metric | Importance |
|---|---|
| Visitor Count | Measures overall reach |
| Page Views | Indicates content interest |
| Bounce Rate | Highlights engagement issues |
| Average Session Duration | Reflects content relevance |
| Traffic Sources | Guides marketing efforts |
Incorporating these metrics into your analytics routine provides a clearer picture of your website’s performance. By consistently monitoring and optimizing based on these insights, you can create a more engaging user experience that keeps visitors coming back.
Engagement Metrics That Matter Most
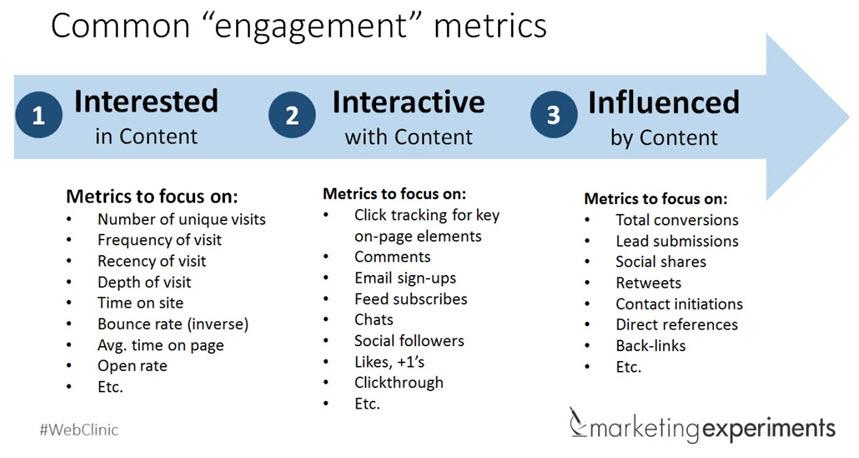
When it comes to gauging the success of your website, understanding engagement metrics is crucial. These metrics provide insights into how visitors interact with your content, revealing areas for improvement and helping shape your digital strategy. Here are some of the most significant metrics you should keep your eyes on:
- Bounce Rate: This indicates the percentage of visitors who leave your site after viewing just one page. A high bounce rate may suggest that your content isn’t resonating with your audience or that your site isn’t user-friendly.
- Average Session Duration: This metric shows how long visitors stay on your site during a single session. Longer durations generally imply that users find your content engaging and valuable.
- Pages Per Session: The average number of pages viewed by a visitor during a session can reveal how compelling your content is.If users are navigating multiple pages, it suggests they are interested in exploring more of what you have to offer.
- Click-Through Rate (CTR): Particularly important for content marketing campaigns, this metric measures the percentage of visitors that click on a specific link or call to action. A higher CTR indicates effective messaging.
- return Visitor Rate: This tells you what percentage of your visitors are coming back. If users are returning to your site, it’s a strong indication that they find value in your content.
To make sense of these metrics, it can be helpful to visualize the data. Here’s a simple table to illustrate some of these engagement metrics:
| Metric | Definition | Optimal Range |
|---|---|---|
| Bounce Rate | Percentage of users leaving after one page | 20% – 40% |
| Average Session Duration | Time spent on site per visit | 2 - 4 minutes |
| Pages per Session | Number of pages viewed per visit | 3 – 5 pages |
| Click-Through Rate | Percentage of clicks on a link/call to action | 2% – 5% |
| Return Visitor Rate | Percentage of users returning to the site | 30% - 50% |
By closely monitoring these metrics, you can gain comprehensive insights into visitor behavior and preferences. This information is essential for optimizing your website’s content and design, ensuring that you not only attract visitors but also keep them engaged. Remember, the goal is to create a website that not only draws in traffic but also fosters a loyal audience that keeps coming back for more.
understanding and tracking these engagement metrics will empower you to make informed decisions about your website strategy. So, dive deep into your analytics and leverage these insights to elevate your online presence and achieve your business objectives.
Conversion Rates: The Ultimate Indicator of Success
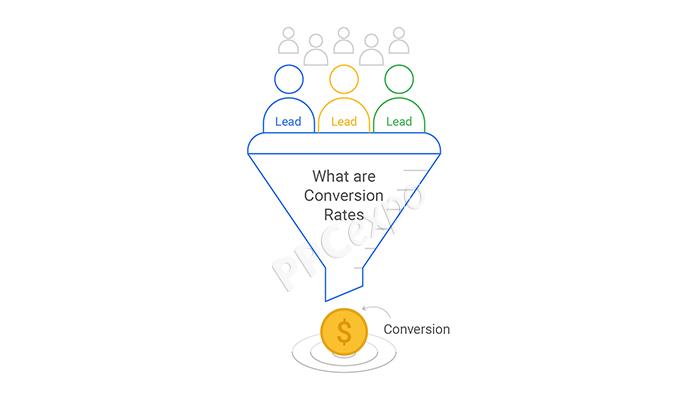
When it comes to measuring the effectiveness of your website, few metrics are as revealing as conversion rates. These rates reflect the percentage of visitors who take a desired action, be it signing up for a newsletter, making a purchase, or filling out a contact form. Understanding and optimizing this key performance indicator (KPI) can significantly impact your business’s bottom line.
Imagine this: you’ve invested time and resources into driving traffic to your website. But what happens if only a small fraction of those visitors actually convert? This is where conversion rates come in. They tell you not just how many people are visiting your site, but how successful you are in persuading them to take action. High conversion rates indicate that your site resonates with your audience, while low rates signal areas that need improvement.
To enhance your conversion rates, consider focusing on the following elements:
- Website Design: An appealing and intuitive design can significantly boost user experience, making visitors more likely to convert.
- Compelling Calls to Action (CTAs): Clear, persuasive CTAs guide users toward the desired actions. The wording and placement matter!
- Quality Content: Engaging and informative content builds trust, encouraging visitors to take the next step.
- Loading Speed: A fast-loading website keeps potential customers from bouncing away in frustration.
Tracking conversion rates also enables you to identify trends and patterns over time. Such as, you might notice that conversions spike during a particular season or after implementing a specific marketing campaign. This insight can help you plan future strategies effectively, ensuring you capitalize on what works best for your business.
Here’s a simple table to illustrate how different factors can affect conversion rates:
| Factor | Impact on Conversion Rate |
|---|---|
| Website design | ↑ Increases user engagement |
| Mobile optimization | ↑ improves accessibility |
| Personalization | ↑ Enhances user experience |
| A/B Testing | ↑ Identifies what works |
Ultimately, tracking and improving your conversion rates isn’t just a numbers game; it’s about understanding your audience and refining your approach to meet their needs. by prioritizing this crucial KPI, you lay the foundation for a successful online presence that not only attracts visitors but also turns them into loyal customers.

Bounce Rate Insights: Why It Can Make or Break You
When it comes to understanding the success of your website, the bounce rate is a critical metric that often gets overlooked. This percentage represents the number of visitors who leave your site after viewing only one page, and a high bounce rate can signal a range of problems. Whether you’re running an e-commerce platform or a blog, analyzing this figure can provide profound insights into user experience and engagement.
Here are some key reasons why bounce rate matters:
- User Engagement: A high bounce rate typically indicates that visitors aren’t finding what they expected. This could mean your content is not resonating with your audience or that your site lacks compelling calls to action.
- SEO Impact: Search engines like Google factor bounce rate into their algorithms. A site with a high bounce rate may be ranked lower in search results, affecting organic traffic.
- Content Quality: If users leave quickly, it might suggest that your content is outdated, irrelevant, or poorly structured. This is an opportunity to reevaluate and enhance what you’re presenting.
Interpreting bounce rate isn’t just about the numbers; context is everything.Such as, a blog may have a higher bounce rate naturally because visitors often read a single article and leave. Conversely, an e-commerce site should aim for a lower bounce rate since customers typically explore multiple products before making a purchase. It’s crucial to understand your industry standards and set benchmarks accordingly.
What Can You Do About High Bounce Rates?
- Improve Content Quality: Regularly update your content to keep it fresh and engaging. use visuals and break up text to enhance readability.
- Enhance User Experience: Ensure your website is visually appealing and easy to navigate. Fast loading times and mobile optimization can significantly reduce bounce rates.
- Call to Action: Incorporate clear and compelling calls to action that guide users to explore more content or products on your site.
To better visualize your website’s performance, consider tracking your bounce rates alongside other KPIs. This comprehensive approach can help you identify patterns and root causes of user behavior. For instance,the following table illustrates how bounce rates can correlate with session duration and pages per session:
| Traffic Source | Bounce Rate (%) | Average Session Duration (mins) | pages per Session |
|---|---|---|---|
| Organic Search | 45% | 3.2 | 3.5 |
| Social Media | 65% | 1.5 | 1.2 |
| Email Marketing | 30% | 4.0 | 5.1 |
By regularly monitoring bounce rates and making necessary adjustments, you not only improve the user experience but also enhance your site’s overall effectiveness.In a competitive digital landscape, even small improvements can lead to significant increases in conversions and customer loyalty. don’t underestimate the power of this KPI—it truly can make or break your online success.

customer Retention Metrics: Keeping Your Audience Coming Back
Understanding customer retention metrics is crucial for any business aiming to build long-term relationships with its audience. These metrics provide insights into customer behavior and engagement, allowing you to tailor your strategies for better retention rates. Here’s a look at some of the most important metrics you should be paying attention to:
- Customer Lifetime Value (CLV): This metric estimates the total revenue you can expect from a single customer over their entire relationship with your brand. Identifying CLV helps in strategizing how much you should invest in acquiring new customers.
- Churn Rate: This indicates the percentage of customers who stop using your service during a specific timeframe.A high churn rate is a red flag, signaling the need for improved customer satisfaction and engagement efforts.
- Repeat Purchase Rate: This metric measures the percentage of customers who make more than one purchase. A higher repeat purchase rate often correlates with effective customer retention strategies.
- Net Promoter Score (NPS): This score gauges customer loyalty by asking how likely customers are to recommend your brand to others. A high NPS indicates strong customer satisfaction and loyalty.
To effectively track these metrics, you can use various tools and analytics platforms. Setting up a dashboard that consolidates these metrics will allow you to monitor trends over time and make data-driven decisions. Consider the following table as a simple guideline for understanding how these metrics can be summarized:
| Metric | Definition | Why It Matters |
|---|---|---|
| Customer Lifetime Value | total revenue expected from a customer | Helps determine customer acquisition costs |
| Churn Rate | Percentage of customers lost | Indicates customer satisfaction levels |
| Repeat Purchase Rate | Percentage of customers who buy again | Measures effectiveness of retention strategies |
| Net Promoter Score | Customer loyalty and satisfaction score | Aids in understanding customer advocacy |
Incorporating these metrics into your business strategy not only helps in understanding your current customer base but also aids in forecasting future trends. By keeping a close eye on these numbers, you can develop targeted campaigns to enhance customer experience, strengthen loyalty, and ultimately, boost your bottom line.
Remember, the goal is not just to attract new customers but to create a community of loyal advocates who will come back time and again. By focusing on retention metrics, you can transform casual buyers into devoted fans of your brand.

How to Effectively Track Your Website KPIs
Tracking your website’s Key Performance Indicators (KPIs) is essential for understanding how well your online presence is performing and where improvements can be made. To effectively monitor these metrics, follow a structured approach that ensures you capture accurate data and derive actionable insights.
Start by defining what success looks like for your website. This involves identifying specific goals that align with your overall business objectives. Once you have clear goals, you can select the right KPIs to track. Some of the most important KPIs to consider include:
- Conversion Rate: The percentage of visitors who complete a desired action.
- Traffic Sources: Understanding where your visitors are coming from helps refine marketing strategies.
- Bounce Rate: The percentage of visitors who leave your site after viewing only one page.
- Average Session Duration: A measure of how long visitors stay on your site.
- Pages per Session: The average number of pages viewed during a session.
Once you’ve identified your KPIs, use analytics tools like Google Analytics to gather data. It’s vital to set up your tracking properly to ensure you’re capturing the correct information. This can include:
- Creating custom events to track specific user interactions.
- Setting up goals in Google Analytics to measure conversions.
- implementing UTM parameters in your marketing campaigns to track effectiveness.
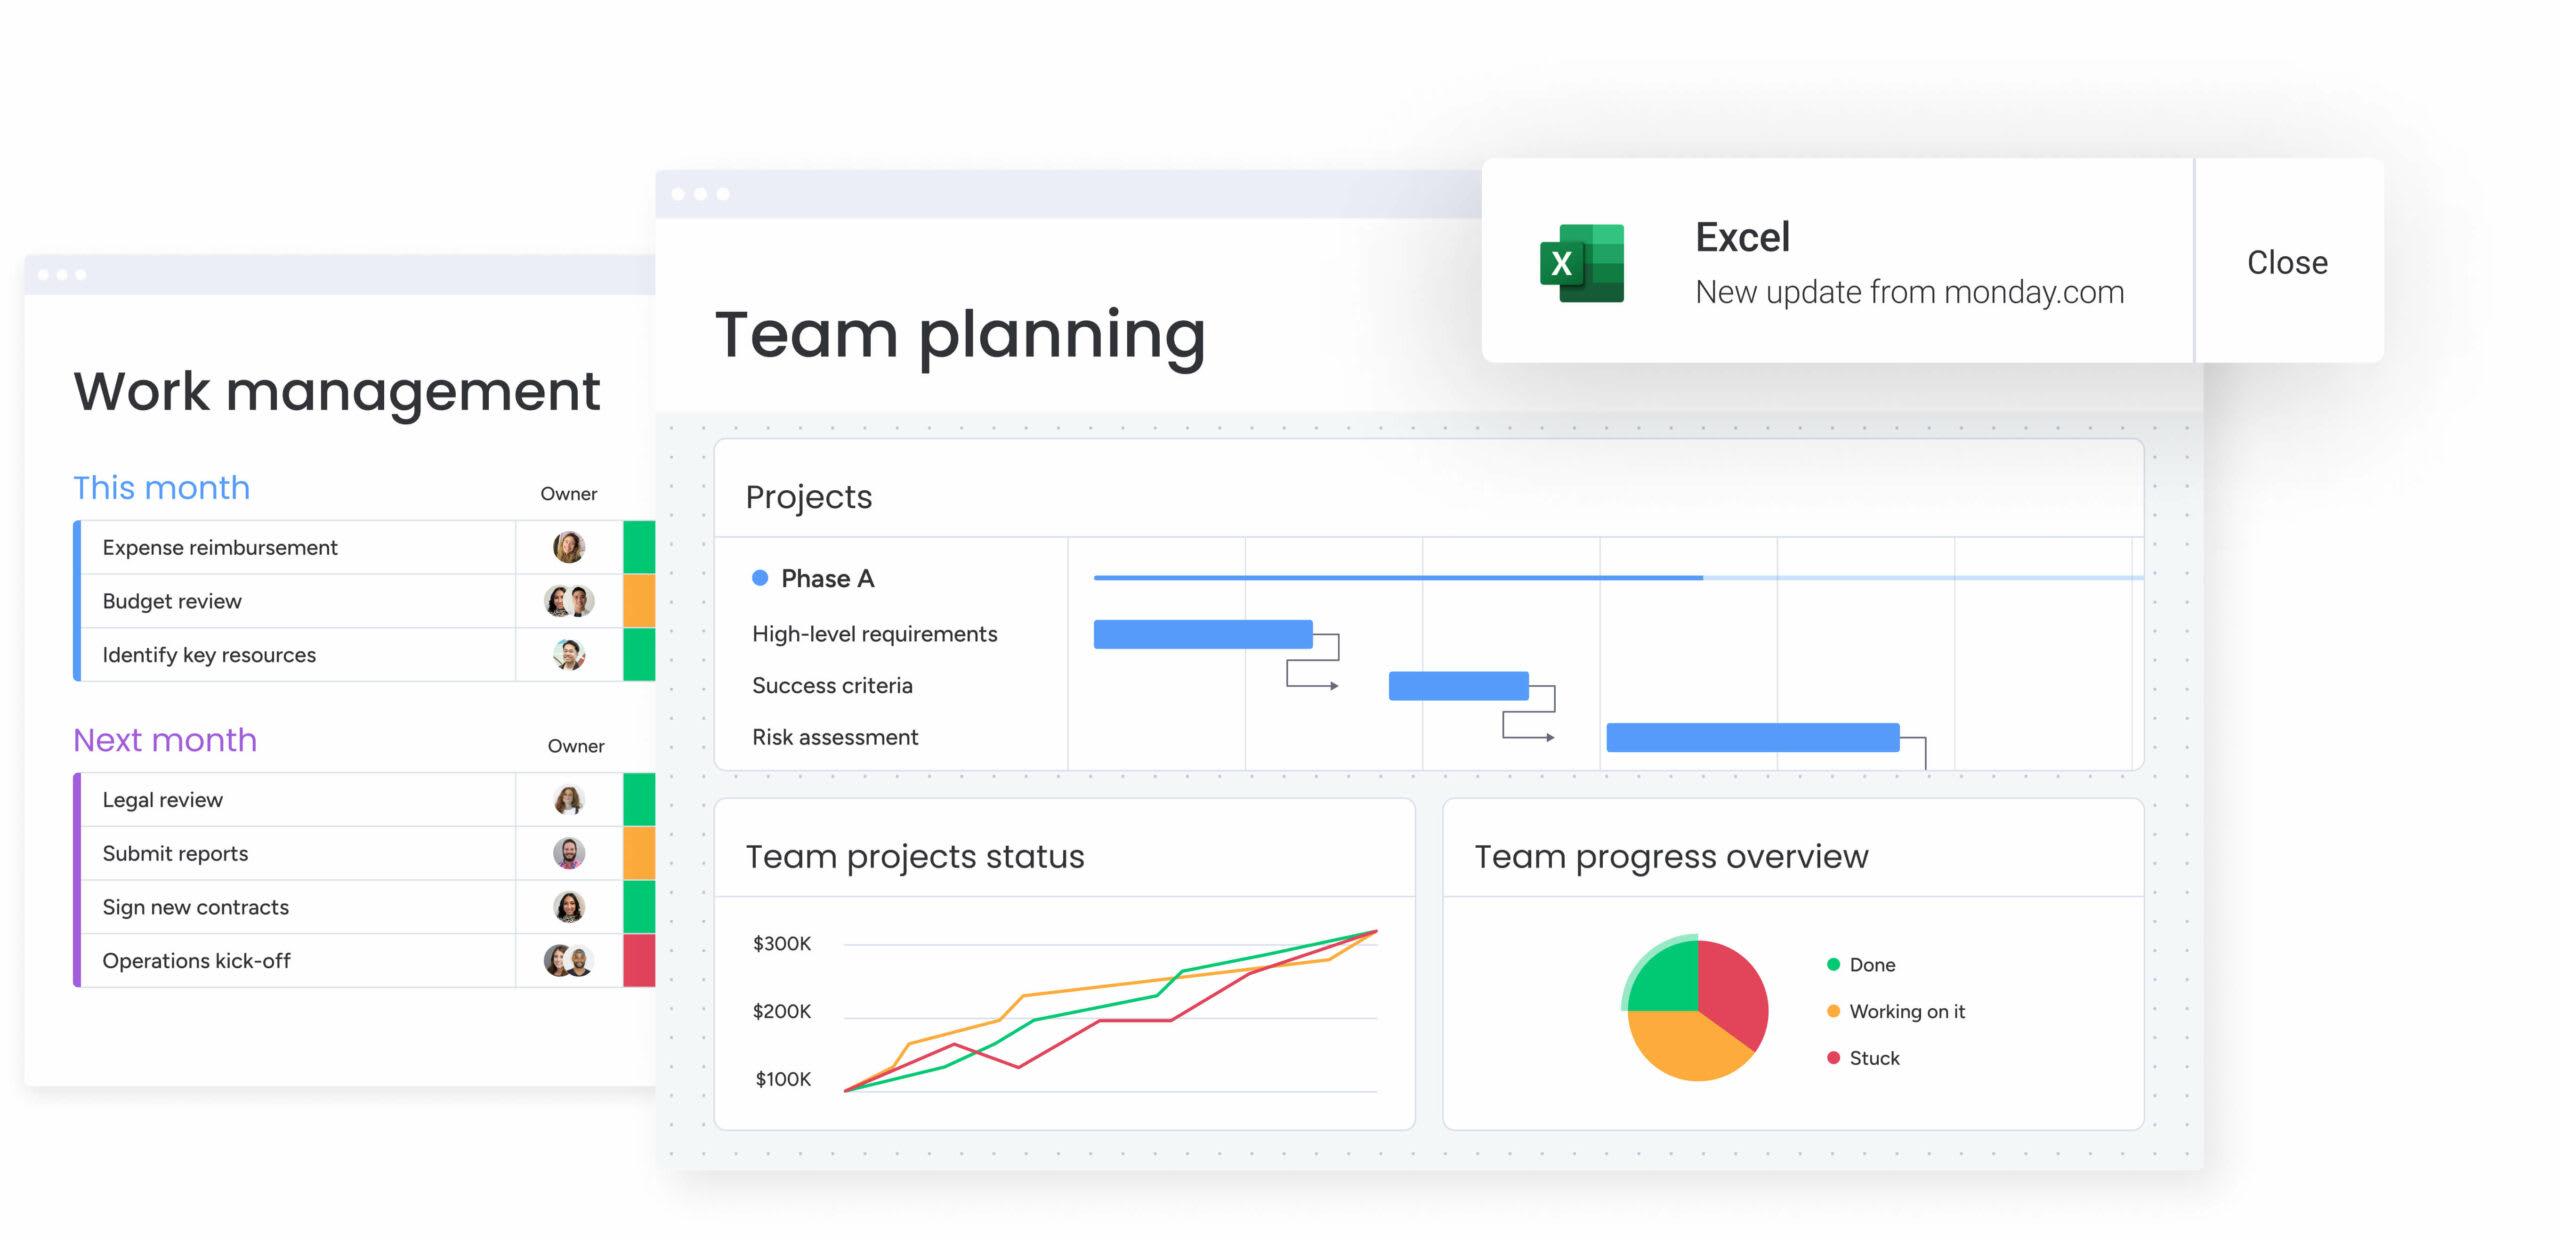
Regularly analyzing your KPIs is just as critically important as tracking them. Schedule monthly or quarterly reviews to assess the data and look for trends. This will help you understand what’s working and what isn’t. Use visual representations like graphs or tables to make your data more digestible.
| Month | Conversion Rate (%) | Bounce Rate (%) | Average Session Duration (mins) |
|---|---|---|---|
| January | 2.5 | 40 | 3.5 |
| February | 3.0 | 38 | 4.0 |
| march | 4.2 | 35 | 4.5 |
Lastly, don’t forget to adjust your strategy based on your findings. If a KPI isn’t moving in the right direction, dig deeper into the data to identify the underlying issues. This proactive approach will help you optimize your website continuously and drive better results over time.
Tools and Software to Simplify KPI Tracking
Tracking Key Performance Indicators (KPIs) doesn’t have to be an overwhelming task. With the right tools and software, you can simplify the process and gain valuable insights into your website’s performance. Here are some top options to consider that can help streamline your KPI monitoring:
- Google Analytics: A powerhouse for tracking website traffic and user behavior. With customizable dashboards, you can monitor metrics like page views, bounce rates, and session durations seamlessly.
- Tableau: Perfect for visualizing data in an engaging way. This tool allows you to create interactive dashboards that can highlight your KPIs at a glance, making data interpretation a breeze.
- HubSpot: If you’re focusing on inbound marketing, HubSpot provides a comprehensive suite to track website performance, including lead generation and customer acquisition metrics.
- semrush: This is more than just an SEO tool. It offers insights into your website’s organic traffic and can help you track keyword performance and competitor strategies.
- Hotjar: Visualize user interactions with heatmaps and session recordings. this tool helps you understand how users navigate your site, providing essential data for optimizing user experience.
Many of these tools come with integration capabilities, allowing you to combine data from various sources for a holistic view. For instance, using Google Data Studio, you can bring data from Google Analytics, social media platforms, and other tools into one cohesive dashboard.
When choosing the right software, consider the following aspects:
| Tool | Best For | Key Features |
|---|---|---|
| google analytics | Traffic Analysis | Real-time data, audience segmentation |
| Tableau | Data Visualization | Custom dashboards, drag-and-drop interface |
| HubSpot | Inbound Marketing | Lead tracking, email performance |
| SEMrush | SEO Insights | Keyword tracking, competitor analysis |
| Hotjar | User Experience | Heatmaps, feedback polls |
Investing in the right tools not only saves you time but can significantly enhance your decision-making process. By continuously monitoring your KPIs, you’ll be equipped to make informed changes that drive your website’s success.

Setting Realistic Goals Based on your KPIs
When it comes to enhancing your website’s performance, setting realistic goals is crucial. Your KPIs, or Key Performance Indicators, provide the roadmap that guides your digital strategy. These metrics not only measure success but help identify areas for improvement. For your goals to be effective, they must be specific, measurable, achievable, relevant, and time-bound (SMART).
Begin by analyzing your current KPIs. This might include metrics like:
- Traffic Sources: Understanding where your visitors are coming from can help direct your marketing efforts.
- Conversion Rates: Knowing the percentage of visitors who take a desired action helps assess your website’s effectiveness.
- Bounce Rate: A high bounce rate might indicate a need for better content or more engaging visuals.
Once you have a clear picture of your KPIs, it’s time to set specific goals. For example, if your current conversion rate is 2%, a realistic goal might be to increase it to 3% over the next quarter. this small, incremental change is attainable and allows you to track progress effectively.
It’s also essential to align your goals with your overall business objectives. If your primary aim is to increase brand awareness, focus on KPIs that reflect engagement, such as:
- Social Shares: A measure of how many people are sharing your content.
- Page Views: A higher number indicates more interest in your content.
Moreover, consider segmenting your goals based on different user demographics. By analyzing user behavior through KPIs, you can set targeted goals that resonate with specific audience segments. As an example, if analytics show that younger users are more engaged on mobile devices, you might aim to enhance mobile site performance for that demographic.
regularly review and adjust your goals based on performance. Use tools like Google Analytics to track your KPIs and determine if your targets are still realistic. If you’re not making the expected progress, don’t be afraid to recalibrate your objectives to better reflect your current situation.
| goal Type | Example Goal | Relevant KPI |
|---|---|---|
| Traffic Increase | Increase monthly visitors by 20% | Website Traffic |
| Engagement | Boost average time on page to 3 minutes | Average Session Duration |
| Lead Generation | Achieve 100 new sign-ups per month | Conversion Rate |

Making Data-Driven Decisions for Continuous Improvement
In the digital landscape, understanding the effectiveness of your website requires more than just intuition; it demands a solid grasp of key performance indicators (KPIs). KPIs are measurable values that demonstrate how effectively a company is achieving its business objectives. For websites, tracking the right KPIs can transform raw data into actionable insights, paving the way for continuous improvement.
When selecting the KPIs to focus on, consider these essential categories:
- Traffic Metrics: These include the number of visitors, page views, and unique visits. understanding where your traffic comes from—be it organic search, paid ads, or social media—enables you to allocate resources effectively.
- User Engagement: Metrics such as bounce rate, average session duration, and pages per session provide insight into how users interact with your site. A high bounce rate might signal that your content needs refinement or that users are not finding what they expect.
- Conversion Rates: Whether your goal is to sell products, generate leads, or encourage newsletter sign-ups, tracking conversion rates allows you to assess the effectiveness of your calls to action and overall website design.
- SEO performance: Keywords, organic traffic, and search engine rankings are crucial for understanding your website’s visibility. Tools like Google Analytics can help you track how your SEO efforts translate into increased traffic.
To visualize these metrics, consider creating a dashboard that highlights your key KPIs. This can include a table like the one below, summarizing the performance of your website over a specific period:
| Metric | Last Month | This Month | Change (%) |
|---|---|---|---|
| Visitors | 1,200 | 1,500 | +25% |
| Bounce Rate | 60% | 55% | -8.33% |
| Conversion Rate | 2.5% | 3% | +20% |
| Average Session Duration | 1:30 | 1:45 | +16.67% |
By regularly monitoring these KPIs,you create a feedback loop that not only informs your current strategies but also guides your future decisions. If you notice a drop in traffic, for example, it might be time to investigate your content strategy or enhance your SEO efforts. Similarly, if conversion rates are lagging, consider A/B testing different layouts or messaging to see what resonates best with your audience.
remember, the goal of tracking KPIs isn’t just to collect data, but to leverage that data for meaningful change. By embracing a data-driven mindset, you can foster a culture of continuous improvement that ultimately leads to better user experiences and stronger business outcomes.
Frequently Asked Questions (FAQ)
Sure! Here’s a Q&A format for an article on “What Is a Website KPI and Which Ones Should I Track?”.
Q: What exactly is a Website KPI?
A: Great question! A Website KPI, or Key Performance Indicator, is a measurable value that helps you understand how well your website is performing in relation to your business goals. Think of KPIs as the scorecard of your website’s effectiveness—they provide insights into user engagement, traffic, and conversion rates, allowing you to make informed decisions to drive growth.
Q: why should I care about tracking KPIs?
A: You might be thinking, “Is tracking KPIs really that important?” Absolutely! Tracking KPIs is crucial because they give you a clear picture of what’s working—and what’s not. By monitoring these metrics, you can identify trends, optimize user experience, and ultimately boost conversions and revenue. ignoring them is like flying blind; you might be moving, but you have no idea if you’re headed in the right direction!
Q: Which KPIs should I focus on for my website?
A: The KPIs you track can vary depending on your goals, but here are some of the most important ones to consider:
- Traffic Sources: Understand where your visitors are coming from—organic search, paid ads, social media, etc. This helps you allocate your marketing budget effectively.
- Bounce Rate: This tells you the percentage of visitors who leave after viewing just one page. A high bounce rate might indicate that your content isn’t engaging or relevant.
- conversion Rate: This is one of the most critical KPIs! It measures the percentage of visitors who take a desired action, like signing up for a newsletter or making a purchase.
- Average Session Duration: This metric shows how long visitors stay on your site. Longer sessions often indicate that users find your content valuable.
- Pages per Session: This tells you how many pages a visitor views in one session. More pages usually mean more engagement!
Q: How often should I review these KPIs?
A: Ideally, you should review your KPIs regularly—monthly is a good starting point. This frequency allows you to spot trends and make timely adjustments without getting lost in the data.Though, if you’re running a campaign or a special promotion, consider checking your KPIs weekly to gauge immediate performance.
Q: What tools can I use to track my KPIs?
A: There are several fantastic tools out there! Google Analytics is a classic choice—it’s free and incredibly powerful for tracking a wide range of KPIs. Other options include SEMrush for SEO metrics, hotjar for user behavior insights, and hubspot for comprehensive marketing analytics. Choose the tools that align best with your needs and expertise!
Q: What if my KPIs aren’t improving?
A: If you find your KPIs stagnating or declining, don’t panic! Start by analyzing the data to pinpoint issues. Is your content resonating with your audience? Are there technical issues on your site? It might be time to rethink your marketing strategy or update your website’s design. The key is to be proactive; staying flexible and willing to adapt is crucial for ongoing success.
Q: Any final tips for tracking KPIs effectively?
A: Absolutely! Set clear, SMART (Specific, Measurable, Achievable, Relevant, Time-bound) goals for each KPI to keep your focus sharp. Don’t just collect data for the sake of it—always ask yourself what the numbers are telling you and how you can use that information to improve. Lastly, remember to celebrate your wins, no matter how small! Each improvement is a step toward a better-performing website.
Feel free to adjust or expand any of the answers to better fit your article’s needs!
To Conclude
understanding and tracking the right Key Performance Indicators (KPIs) for your website is crucial for navigating the digital landscape effectively. These metrics not only help you gauge the success of your online presence but also guide your decision-making process as you strategize for growth. Whether it’s monitoring your website traffic, conversion rates, or user engagement, each KPI provides valuable insights that can steer your efforts in the right direction.
So,don’t just let your website float aimlessly in the vast ocean of the internet. Take the helm,and start tracking these essential KPIs! By doing so,you’ll not only enhance your site’s performance but also deliver a better experience for your visitors. Remember, knowledge is power, and armed with the right data, you can make informed choices that propel your website to new heights.
Ready to dive in? Start by identifying which KPIs resonate most with your goals and watch how your online strategy transforms. Happy tracking!